As a social landlord, we report quarterly Tenant Satisfaction Measures (TSMs) to the Regulator for Social Housing (RSH) to help track our performance.
You can see how we’ve performed against the TSMs during April 2024-March 2025 below:

You can see how we’ve performed against the TSMs during April 2024-March 2025 below:
The Tenant Perception Measures focus on how open we are with our customers and whether we treat them with fairness and respect, as well as how we help them:
MEL Research, an independent research company, conducts a quarterly telephone survey. The feedback helps us look at potential areas for improvement or investigation.
of respondents report they are satisfied with the overall service from us (TP01)
of respondents who've received a repair in the last 12 months are satisfied with our repairs service (TP02)
of respondents who’ve received a repair in the last 12 months are satisfied with the time taken to complete the most recent repair (TP03)
of respondents report that they are satisfied that their home is well maintained (TP04)
of respondents report that they are satisfied that their home is safe (TP05)
of respondents report that they are satisfied that we listen to tenant views and act upon them (TP06)
of respondents report that they are satisfied that we keep them informed about things that matter to them (TP07)
of respondents report that they agree we treat them fairly and with respect (TP08)
of respondents who reported making a complaint in the last 12 months are satisfied with our approach to complaints handling (TP09)
of respondents with communal areas report they are satisfied that we keep communal areas clean and well maintained (TP10)
of respondents report that they are satisfied that we make a positive contribution to the neighbourhood (TP11)
of respondents report that they are satisfied with our approach to handling anti-social behaviour (TP12)
We carry out regular checks and assessments to help keep homes safe. The building safety measures show whether or not we’ve met the standard checks and highlight areas that we might need to focus on.
is the proportion of homes for which all required gas safety checks have been carried out (BS01)
is the proportion of homes for which all required fire risk assessments have been carried out (BS02)
is the proportion of homes for which all required asbestos management surveys or re-inspections have been carried out (BS03)
is the proportion of homes for which all required legionella risk assessments have been carried out (BS04)
is the proportion of homes for which all required communal passenger lift safety checks have been carried out (BS05)
Anti-social behaviour is any behaviour that causes nuisance, alarm or annoyance. The anti-social behaviour measures show how many anti-social behaviour cases have been opened.
is the number of anti-social behaviour cases, opened per 1000 homes (NM01[1])
is the number of anti-social behaviour cases that involve hate incidents, opened per 1000 homes (NM01[2])
The complaints measures show how many complaints we’ve received at each stage of the complaint process. We use complaint feedback to help us learn and improve.
is the number of stage 1 complaints received per 1000 homes (CH01[1])
is the number of stage 2 complaints received per 1000 homes (CH01[2])
is the proportion of stage 1 complaints responded to within the Housing Ombudsman’s Complaint Handling Code timescales (CH02[1])
is the proportion of stage 2 complaints responded to within the Housing Ombudsman’s Complaint Handling Code timescales (CH02[2])
When customers tell us there’s a problem in their home our aim is to resolve this quickly and efficiently. The Decent Homes Standard and repairs measures show how well we understand the condition of homes and whether we’re carrying out repairs within reasonable timescales.
is the proportion of homes that do not meet the Decent Homes Standard (RP01)
is the proportion of non-emergency responsive repairs completed within 20 working days (RP02[1])
is the proportion of emergency responsive repairs completed within a maximum of 24 hours (RP02[2])
Download the documents below to learn more about how we collected the survey results:
Learn more about our approach to collecting feedback for the Tenant Perception Measures element of the Tenant Satisfaction Measures (TSMs)
File Type: pdf
File Size: 599 KB
Last Updated: June 2025
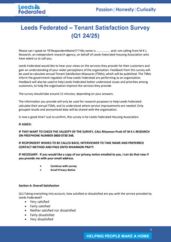
This is a copy of our Tenant Satisfaction telephone survey for quarters 1-4 in 2024-2025. It includes the survey and telephone script.
File Type: pdf
File Size: 3 MB
Last Updated: July 2025
This page was updated on the 27th June 2025.